COVID-19 Forecasts: Cases (from the USA, what more for the PHL..)

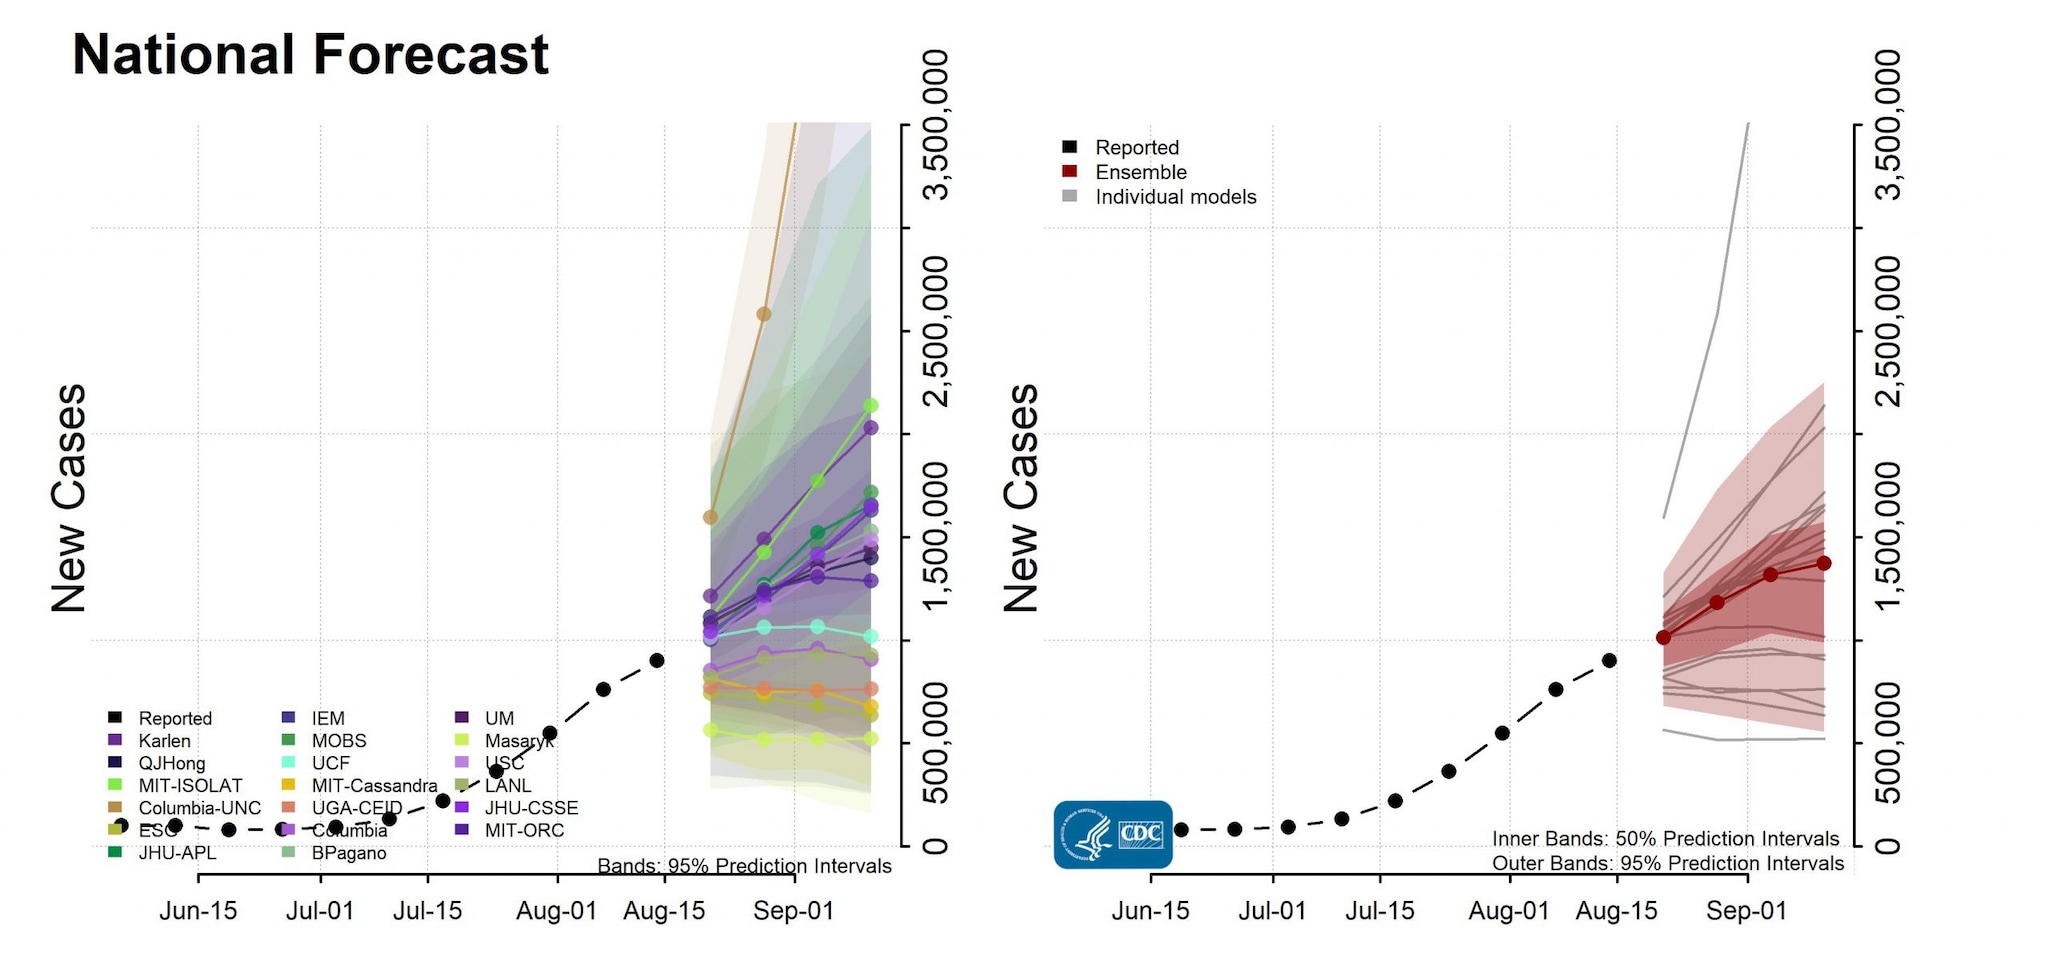
Reported and forecasted new and total COVID-19 cases as of August 16, 2021.
Interpretation of Forecasts of New Cases
- This week, ensemble forecasts of new reported COVID-19 cases over the next 4 weeks included forecasts from 22 modeling groups, each of which contributed a forecast for at least one jurisdiction.
- This week’s national ensemble predicts 560,000 to 2,250,000 new cases likely reported in the week ending September 11, 2021.
- Over the last several weeks, more reported cases have fallen outside of the forecasted prediction intervals than expected. This suggests that current forecast prediction intervals may not capture the full range of uncertainty. Because of this, case forecasts for the coming weeks should be interpreted with caution.
National Forecasts
- The figure shows the number of new COVID-19 cases reported in the United States each week from June 12 through August 14 and forecasted new cases over the next 4 weeks, through September 11.
- Models make various assumptions about the levels of social distancing and other interventions, which may not reflect recent changes in behavior. See model descriptions below for details on the assumptions and methods used to produce the forecasts.
Download national forecast data excel icon[XLS – 21 KB]
State & County Forecasts
State-level and county-level forecasts show the predicted number of new COVID-19 cases for the next 4 weeks by jurisdiction. Each forecast figure uses a different scale due to differences in the number of COVID-19 cases between jurisdictions. To aid in comparisons between jurisdictions, the ensemble plot for each location has a second axis (in grey) that shows the expected number of cases per 100,000 people. Only forecasts meeting a set of ensemble inclusion criteria are shown; further details are available here: https://covid19forecasthub.org/doc/ensemble/external icon. Plots of the state-level and county-level ensemble forecasts and the underlying data can be downloaded below.
Download forecasts for states and territories and for counties pdf icon[PDF – 9 MB]
Download all forecast data excel icon[CSV – 11 MB]
Additional forecast data and information on forecast submission are available at the COVID-19 Forecast Hubexternal icon.
Forecast Inclusion and Assumptions
The teams with forecasts included in the ensembles are displayed below. Forecasts are included when they meet a set of submission and data quality requirements, further described here: https://github.com/reichlab/covid19-forecast-hub#ensemble-modelexternal icon.
The forecasts make different assumptions about social distancing measures. Additional individual model details are available here: https://github.com/cdcepi/COVID-19-Forecasts/blob/master/COVID-19_Forecast_Model_Descriptions.mdexternal icon
Intervention assumptions fall into multiple categories:
- These modeling groups make assumptions about how levels of social distancing will change in the future:
-
- Columbia Universityexternal icon (Model: Columbia)
- Massachusetts Institute of Technology, Operations Research Centerexternal icon (Model: MIT-ORC)
- These modeling groups assume that existing social distancing measures in each jurisdiction will continue through the projected 4-week time period:
-
- Bob Paganoexternal icon (Model: BPagano)
- Columbia University and University of North Carolinaexternal icon (Model: Columbia-UNC)
- Facebook AI Research (Model: Facebook)
- IEMexternal icon (Model: IEM)
- Johns Hopkins University, Applied Physics Labexternal icon (Model: JHU-APL)
- Johns Hopkins University, Center for Systems Science and Engineeringexternal icon (Model: JHU-CSSE)
- Johns Hopkins University, University of North Carolina, and Googleexternal icon (Model: JHU-UNC-Google)
- Karlen Working Groupexternal icon (Model: Karlen)
- Los Alamos National Laboratoryexternal icon (Model: LANL)
- Masaryk Universityexternal icon (Model: Masaryk)
- MIT-Cassandraexternal icon (Model: MIT-Cassandra)
- Massachusetts Institute of Technology, Institute for Data, Systems, and Societyexternal icon (Model: MIT-ISOLAT)
- Northeastern University, Laboratory for the Modeling of Biological and Socio-technical Systemsexternal icon (Model: MOBS)
- Pandemic Centralexternal icon (Model: PandemicCentral)
- Qi-Jun Hongexternal icon (Model: QJHong)
- Robert Walravenexternal icon (Model: ESG)
- University of Central Floridaexternal icon (Model: UCF)
- University of Georgia, Center for the Ecology of Infectious Diseaseexternal icon (Model: UGA-CEID)
- University of Michiganexternal icon (Model: UM)
- University of Southern Californiaexternal icon (Model: USC)
1The full range of the prediction intervals is not visible for all state plots. Please see the forecast data for the full range of state-specific prediction intervals.

